A large part of my day is spent scripting in PowerShell, specifically with PowerCLI. One of the strongest areas of PowerCLI, obviously, is being able to retrieve information. It’s one of the key use cases, in my opinion, for using PowerCLI in a VMware environment, it’s ability to retrieve information for Capacity planning and reporting.
Recently I’ve been looking at how to consume all that information. You can obviously export it to a CSV, push it into a database, or something that I’ve been playing around with recently, stream it into Power BI. Now if you haven’t tried it out yet, PowerBI is an analytics service from Microsoft. At its core it’s a data warehouse for business intelligence. But putting all those fancy words aside, I use it to create fancy reports.
Exporting information out of a vCenter environment with PowerCLI is dead simple. I have dozens of scheduled tasks running all the time doing this. Where I’ve fallen down, is taking that information and trending it over time. This is where the Streaming Datasets functionality of Power BI comes in. Using PowerCLI I can get an Object and Value from vCenter and then Post that directly into Power BI, using their API, and have it instantly graphed in a report. I can then share that report out to anyone I want. Power BI lets me do this over and over, almost as fast as I can pull the information out of vCenter.
In the example below I show how to create a trend report over time that displays Total and Available Storage of a vCenter Cluster. Rather simple, I know, but can easily be adapted to show things like number of running VMs running, reserved resources used, etc, etc. The skies the limit really.
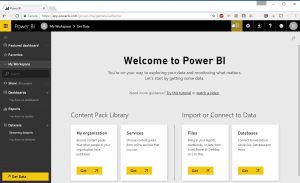
Before we do any scripting the first thing we do is log into Power BI. If you don’t have an account, don’t worry, the basic version is free. Hit the Sign Up link and make sure you select Power BI and not Power BI Desktop for Windows, we want the cloud version.
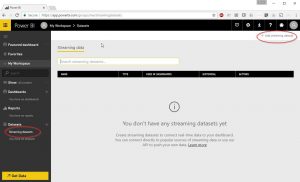
Once logged in we click on Streaming Datasets in the bottom left under the Datasets category. This is where we create our initial dataset schema so that it can accept streaming input. We click on ‘Add streaminig dataset’ in the top right.
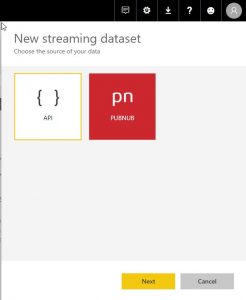
Then select the source of data, which will be API and click next.
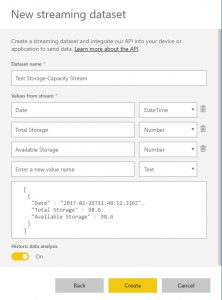
We give our New Streaming Dataset a name and define a few values. In this example we will define a Date, Total Storage, and Available Storage value, turn on Historic Data Analysis and click Create. Make note of your data type to the right of the value. Date is DateTime and the other two are Numbers.
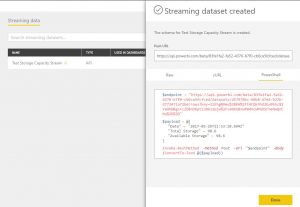
We’ve now created our schema and are provided with a Push URL address and sample code in a few different formats (we want PowerShell). If you look carefully we are using an Invoke-RestMethod to Post to Power BI. This sample code has just provided us the template and hardest part of our PowerShell / PowerCLI script. Click over the code and copy / pasta it out to use in our script (Paste it at the bottom of the script as it will be the last thing that runs).
Now we actually start on the PowerShell / PowerCLI script. To keep it as concise as possible. I’ve skip the process I use to actually connect to the vCenter and retrieve the information out using PowerCLI in the code below. The real goal here is just to retrieve some values and get that into Power BI. Line 6 is basically retrieving all shared VMFS datastores in Cluster1. The important lines to note, though, are 4, 8, and 9 where I store my key values in three variables. One for Date, one for TotalStorage, and one for AvailableStorage.
Import-Module VMware.VimAutomation.Core
Connect-VIServer -Server host.mydomain.local

$date = Get-Date

$datastore = Get-Cluster -Name Cluster1 | Get-Datastore | Where-Object {$_.Type -eq 'VMFS' -and $_.Extensiondata.Summary.MultipleHostAccess}

$TotalStorage = ($datastore | Measure-Object -Property CapacityMB -Sum).Sum / 1024
$AvailableStorage = ($datastore | Measure-Object -Property FreeSpaceMB -Sum).Sum / 1024
The additional lines below from 11 onward is the important code. This is our pasted sample code from Power BI that we will slightly modify to push our values up to Power BI. Don’t copy mine, as your URL and key will be different. On lines 13, 14, and 15 we will remove the example values and replace it with our three variables, $Date, $TotalStorage, and $AvailableStorage.
Import-Module VMware.VimAutomation.Core
Connect-VIServer -Server 10.1.1.201 -user "mydomain\username"

$date = Get-Date

$datastore = Get-Cluster -Name Cluster1 | Get-Datastore | Where-Object {$_.Type -eq 'VMFS' -and $_.Extensiondata.Summary.MultipleHostAccess}

$TotalStorage = ($datastore | Measure-Object -Property CapacityMB -Sum).Sum / 1024
$AvailableStorage = ($datastore | Measure-Object -Property FreeSpaceMB -Sum).Sum / 1024

$endpoint = "https://api.powerbi.com/beta/83fe1fa2-fa52-4376-b7f0-cb645a5fcfced/datasets/d57970bc-60b3-46e6-b23b-d782431a72be/rows?key=2zEhgN9mu%2BEH%2FI2Cbk9hd2Kw4b5c84YaO6W8gzFcZbBnO6rti3N631Gjw%2FveNXSBxwR84VcWPGOSrheNwQnCbw%3D%3D"
$payload = @{
"Date" = $Date
"Total Storage" = $TotalStorage
"Available Storage" = $AvailableStorage
}
Invoke-RestMethod -Method Post -Uri "$endpoint" -Body (ConvertTo-Json @($payload))

Disconnect-VIServer * -Confirm:$false
On the last line I disconnect from my vCenter and close any sessions. This helps if running as a scheduled task. Finally save the script.
And that’s it for the scripting part. Assuming everything is correct, no connection issues, correct values being retrieved. All we have to do is run the script and it will send a POST request using Invoke-RestMethod with our three values. We can now run this script as many times as we want and it will continue to post the current date and time along with Total Storage and Available Storage. At this point, if we wish, we can turn the script into a scheduled task or just continue to run manually to suit our needs.
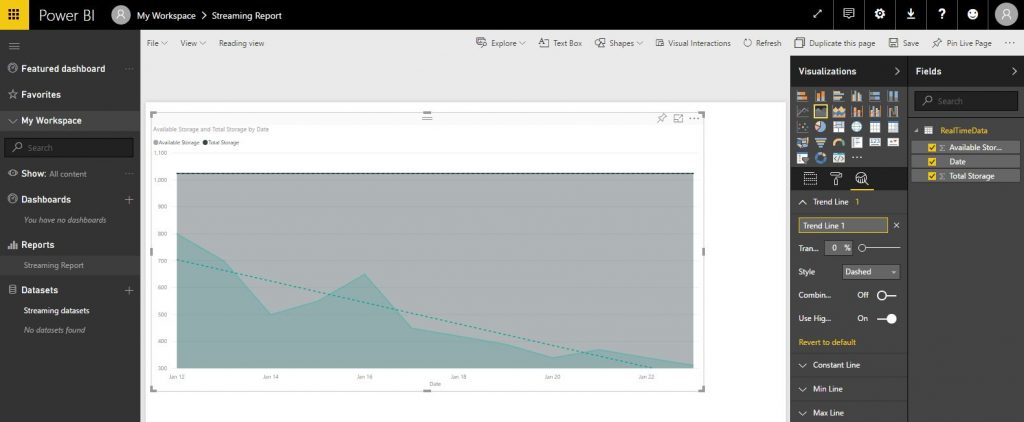
We now go back to Power BI and report on what we have. Back on our Streaming Datasets browser window we click the Create Report icon under actions. Now this part is going to be very subjective to the end user who wants the report. But the key data we want is under RealTimeData on the far right. Select all three values and we get presented with a default view of our data. Under Visualizations select line chart and now we start to see a more visual representation of our capacity over time. Under the Analytics section add a trend line and see a basic view of available capacity over time. Finally hit save and you have a self updating report from streaming data.
For the report to start to look anything like below it will take time and a few sample datasets. In the below image I’ve mocked up some numbers over time as an example.
Once you have a working script and it’s streaming data to PowerBI it’s really up to you on how to report on it. The above example, as simple as it is, lays the ground work to more customized and complex reporting that you might not be able to get out of traditional monitoring and reporting software. The ability is there to even share out the report.
Streaming datasets, as you might have noticed in the UR, is still in beta. As great as I have found it to be it does have some quirks. For one you can’t easily modify data you have already streamed up to Power BI. So if you send incorrect data / values up to Power BI in a streaming dataset it will remain their. At which point you will have to consider Filters to exclude it in reports.
In summary I think Power BI is a very underrated free tool from Microsoft. I’ve only just started to scratch the surface of what’s possible with it. The simplicity of capturing data with PowerShell and sending it to Power BI is well worth the time and effort to try at least once. So what are you waiting for?